Electricity
Que 1. A battery E is connected to three identical lamps P, Q and R as shown in figure:
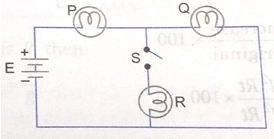
Initially the switch S is kept open and the lamp P and Q are observed to glow with some brightness.
Then switch S is closed.
How will the brightness of glow of bulbs P and Q will change? Justify your answer.
Ans. The brightness of glow of bulb P will increase and brightness of glow of bulb Q will decrease. This is because on closing S, bulbs Q and R will be in parallel and the combination will be in series with bulb P. Hence the total resistance of the circuit will decrease and the current flowing in the circuit will increase. Therefore, the glow of bulb P will increase.Also since bulbs Q and R will be in parallel in this case, the current gets divided and lesser current flows through Q and hence the glow of bulb Q will decrease.
Que 2. V-I graph for the metallic wires X and Y at constant temperature are as shown in figure:
Assuming that the two wires have same length and same diameter, explain as to which of the two wires has higher resistivity and why?
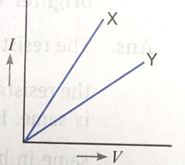
Ans. The slope  of the graph represents
  since the graph marked Y has lesser slope, it represents higher resistance.
Since the length and diameter of the two wires is same, using the relation  the resistively of wire Y will be higher.
Que 3. Why is an ammeter likely to be burnt out if it connected in parallel in a circuit?
Ans. The resistance of an ammeter is very low. If an ammeter is connected in parallel, the resultant resistance of the circuit decreases and excessive current passes through the instrument. Hence, the ammeter is likely to be burnt out.
Que 4. Current I flowing through a resistor results in dissipation of power P. By what percentage will the power dissipated in the resistor increase if the current through the resistor is increased by 50%? Justify your answer with the help of mathematical calculations?
Ans. The power dissipated in the resistor will increase by 125%.
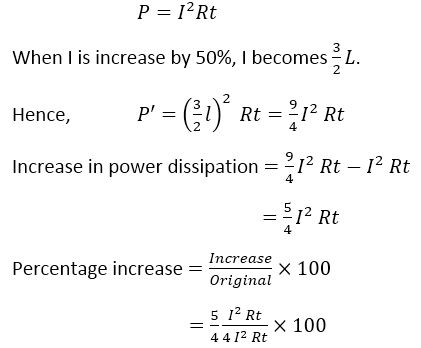
= 125%
Que 5. What are the possible values of resistances which one can obtain by using resistor of values 2
Ans. The following combinations can be obtained:
(i) The individual resistances: 2
(ii) All in series: 11
(iii) All in parallel: 1
(iv) Three different possible mixed grouping of resistors: 
Que 6. Out of two electric bulbs of W – 220 V and 100W - 220 V. Which one will glow brighter when they are connected (i) in series, and (ii) in parallel?
Ans. The resistance if the bulb is defined as  So the resistance of 50 W bulb is double than the resistance of 100 W bulb. When they are connected in series the current through both bulbs is same. Hence 50 watt bulb will be brighter because P = I2 R. In parallel, the voltage will be same in both bulbs. So, the 100 watt bulb will be brighter because
Que 7. Given n resistors each of resistance R, how will you combine them to get the (i) maximum; and (ii) minimum effective resistance? What is the ratio of maximum to minimum resistance?
Ans. For maximum effective resistance, the resistors must be connected in series combination. If then are n resistors each of resistance R, then the maximum effective resistance = nR
For minimum effective resistance, the resistors must be connected in parallel combination. So, the minimum effective resistance 
Ratio of the maximum to minimum resistance is 
Que 8. What is the resistance from A to B in the network shown in the figure?

Ans. The point C is connected to B and the point D is connected to A. Therefore, three identical resistors, each having resistance R, are connected in parallel and the equivalent circuit diagram is shown in the figure.
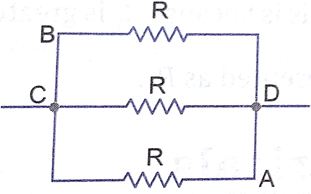
If the equivalent resistance is R’ then

Que 9. Two students perform the experiment on series and parallel combinations of two given resistors R1 and R2 and plot the following V – I graphs (a) and (b).
Which of the graphs is (are) correctly labelled in terms of the words ‘series’ and ‘parallel’? Justify your answer.
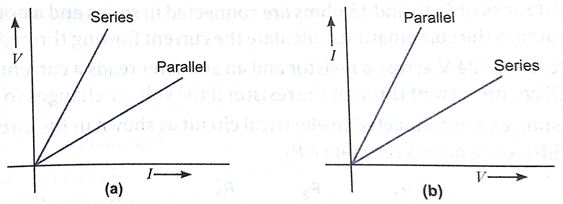
Ans. (a) 
As larger resistance represented series combination and smaller resistance the parallel combination. Therefore, graph of greater slope represented series combination and hence it is correctly labelled.
Que 10. Two students perform experiments on two given resistors R1 and R2 and plot the following V – I graphs. If R1 > R2. Which of the two diagrams correctly represent the situation on the plotted curves? Justify your answer.
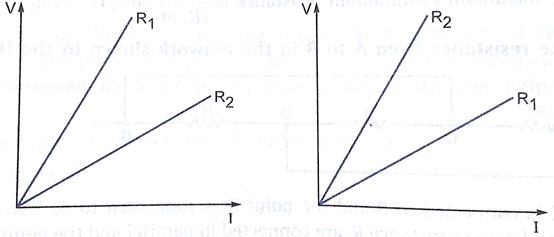
Ans. As R1 > R2
Therefore, figure (a) is correct. This is because R1 is greater so the slope of V – 1 graph  is greater in figure (a) and is correctly represented as R1.

